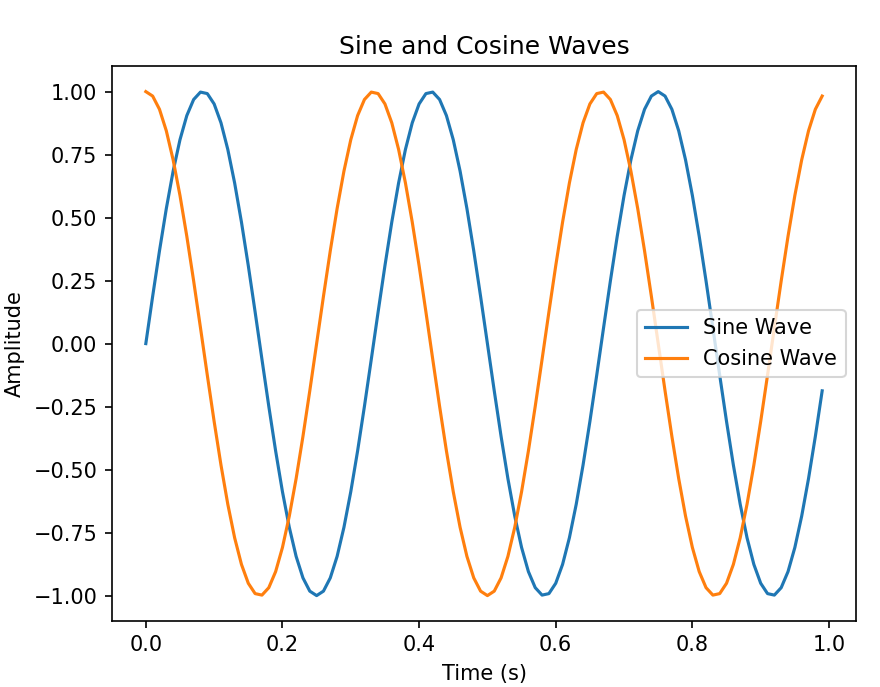
To plot both sine and cosine waves,
you can define and plot both functions together
Code that plots the sine and cosine waves on the same graph.
If you're using VS Code and not seeing the plot, there are a few things
you can check to make sure the plot is displayed properly:
1. Install Necessary Libraries
Ensure that you have both numpy and matplotlib installed. If not, you can install them using the following commands in your terminal.
pip install numpy matplotlib
2. Check VS Code Python Interactive Mode
Ensure you are running your code in a Python Interactive window.
In VS Code, you can run your script in the Python Interactive window by
right-clicking your script and selecting "Run Python File in Terminal" or
by running individual cells if you are using a .ipynb (Jupyter Notebook) file.
3. Check Output in Terminal
If you are running the script in the VS Code terminal,
try explicitly calling plt.show() at the end of your script to ensure the plot is rendered:
Simple Python code:
----------------------------------------------------------
# to plot sine and cos wave
#import libraries
import numpy as np
import matplotlib.pyplot as plt
# to define independent and dependent variable
t = np.arange(0,1, 0.01)
xt= np.sin(2*np.pi*3*t)
#to plot the signal
plt.plot(t,xt) #till here write and run and the output terminal
plt.show() #write this to show the plot
-------------------------------------------------------
Code with Legend:
------------------------------------------------------------------------------
import numpy as np
import matplotlib.pyplot as plt
# define independent variable (time)
t = np.arange(0, 1, 0.01)
# define dependent variables (sine and cosine waves)
sine_wave = np.sin(2 * np.pi * 3 * t)
cosine_wave = np.cos(2 * np.pi * 3 * t)
# plot the signals
plt.plot(t, sine_wave, label='Sine Wave')
plt.plot(t, cosine_wave, label='Cosine Wave')
# add labels and title
plt.xlabel('Time (s)')
plt.ylabel('Amplitude')
plt.title('Sine and Cosine Waves')
# add a legend
plt.legend()
# display the plot
plt.show() # ensure this is included to display the plot in VS Code
----------------------------------------------------------
Output:
Explanation:
The expression sin(2 * np.pi * 3 * t) represents a
sine wave with the following characteristics:
Amplitude: The sine function typically has an
amplitude of 1 unless it's scaled by a factor.
Frequency: The term 3 indicates that the sine wave
completes 3 full cycles per second.
This is the frequency in Hertz (Hz).
Angular frequency: The factor 2 * np.pi * 3 is the
angular frequency in radians per second.
In general, angular frequency is related to
frequency 𝑓 by ω=2πf.
Time variable: The variable t is typically time and determines
the phase of the sine wave at any given moment.
------------------------------------------------------
#To plot sampled sine (and cosine signal)
import numpy as np
import matplotlib.pyplot as plt
n= np.arange(0,1,0.01)
xn= np.sin(2*np.pi*3*n)
#xn1= np.cos(2*np.pi*3*n)
#plot the signal
plt.stem(n,xn, label= "sine wave")
#plt.stem(n,xn1, label= "cosine wave")
plt.title("hello pradeep bhai, its sine # (and cosine sampled )signal")
plt.xlabel("---> n ")
plt.ylabel("Amplitude in volts")
plt.legend()
plt.show()
-------------------------------------
note : 1.Select Sample spacing 0.01 wisely for display in line 3
so select resolution accordingly.
2. stem used for discrete time sequence in place
of plot for continuous time signal.
----------------------------------------------------------------


No comments:
Post a Comment